Planisware Enterprise Audit

Usage
Want to know the metrics of your Planisware Enterprise tool? Wish to know how your users use your PPM tool? Do you need to set up supervision tools to monitor your application?

Performance
Are you annoyed by the slowness of your application? People are not getting the right value from the application because the tool is not optimized?

Optimization
Would like to optimize your Planisware Enterprise solution? Need to clean up your application from obsolete data? Looking for clues and advice from experts on your solutions?
Our expertise at your service
Get all benefits from an external view of your current application and infrastructure. Basicaly an audit is the opportunity to get the necessary perspective to properly assess your situation. Based on our expertise on Planisware solution and infrastructure we will provide useful and practicle insights.
Performance is often a sensitive point during design and developement of applications. Nevertheless, it only becomes a critical problem when it severely affects your application and user satisfaction. In conclusion, audit can help you figure out the various improvement areas that may exist on your product.
A simple audit process
Framing
- Identification of issues, pain points, deadlines, budget and objectives to define a clear scope for the audit
Audit and analysis
- Analysis of the current situation (architecture and usage)
- Monitoring of application and infrastructure using different sources (logs, W7 logs, nmon, sar...)
- Data analysis and identification of areas for improvement
- Check software and midleware technical obsolescence
Restitution
- Sharing results and recommendations (architecture, performance, security...) according to their priority and cost
Typical audit scope
Use and operation of middlewares and bottlenecks
Possible points of analysis:
- Database configuration and performance
(Oracle, Postgres, SQL Server) - Configuration and performance of web servers (IIS, Apache)

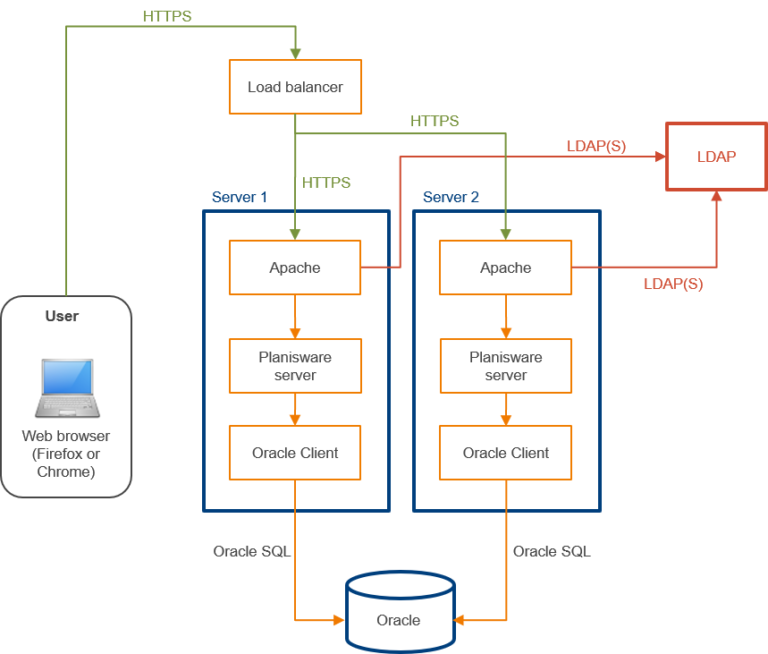
Current architecture (logical and technical)
Possible points of analysis:
- Server type : VM or physical server
- Server model
- CPU type and #vCPU (vs. Best practices)
- RAM and SWAP size
- Presence of clustering (several clusters each loading a different data perimeter)
- BDD-side storage type (e.g. SSD, HD)
Obsolete or useless data in the database
Possible points of analysis:
- Obsolete data (logically deleted, orphan objects…)
- Reference data
- Logically deleted projects
- Transaction retention period

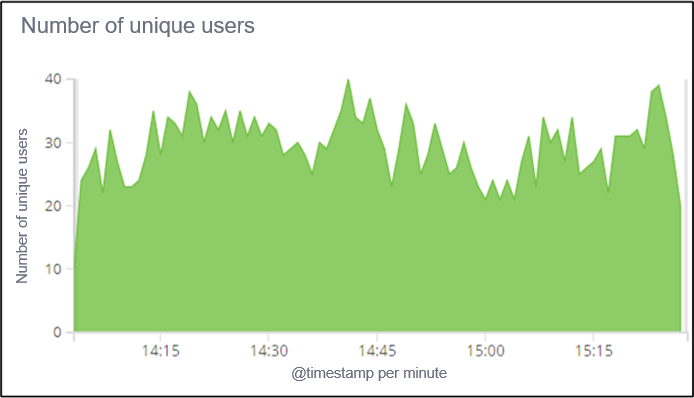
Current load of the application over a significant period of time
Possible points of analysis:
- Number of connected users and competitors
- Distribution of users over the different Intranet Slaves
- Identification of peak load periods
Top functionalities considered as slow by the business
Possible points of analysis:
- Unit performance measurement
(on real volume but with only 1 user) - Review of specific configuration
- Planisware monitoring


Current use of the application (technical part)
Possible points of analysis:
- Mapping of batches and their sequencing
- Batch processing times
- Service start-up time
- Master Intranet process size
- Frequent errors in the logs
- Untimely restart of services
Use of server capacities (RAM, SWAP, CPU...) and its bottlenecks
Possible points of analysis:
- Use of RAM
- Presence and use of SWAP
- CPU usage (peak, average)
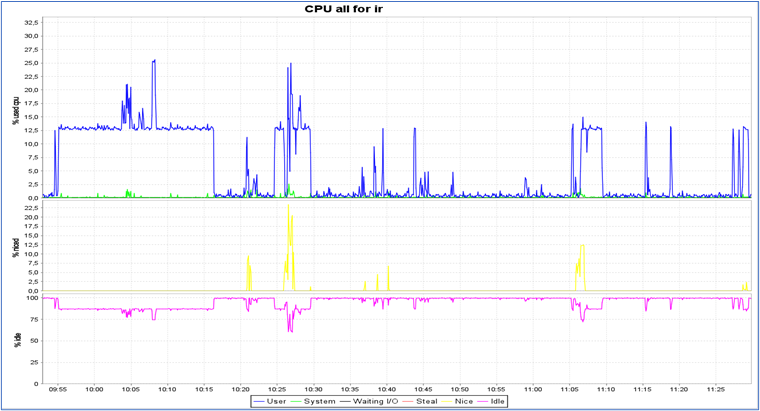
Why choose Bloom PPM?
"Get the most out of project management solutions, with complete peace of mind"

A modular approach adapted to your challenges and budget

Functional and technical expertise on Planisware and its infrastructure

Satisfied customers


